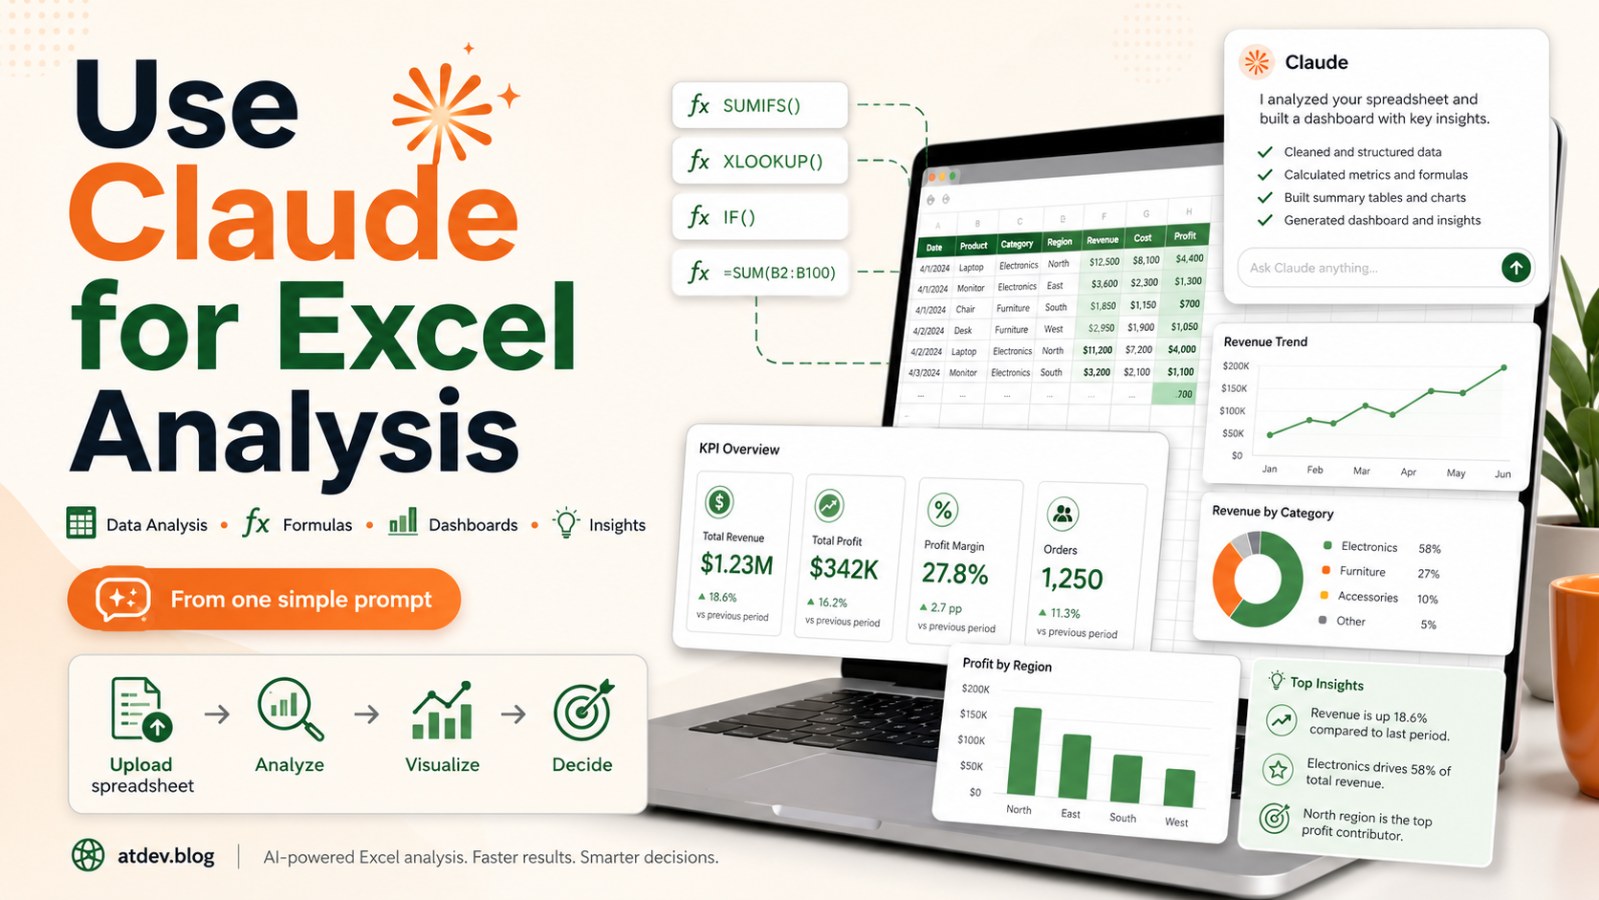
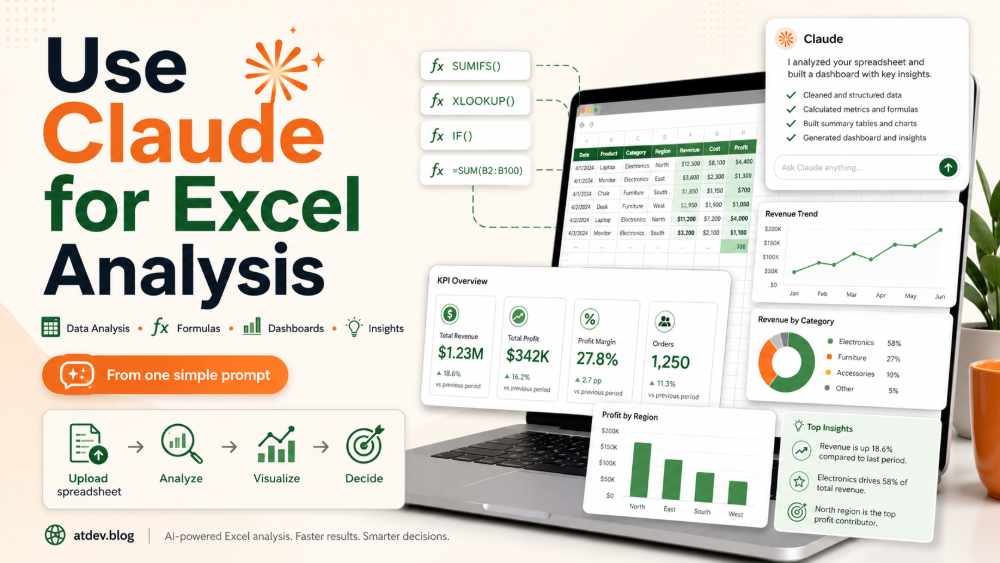
How to Use Claude for Excel Analysis, Formulas, Dashboards and Business Insights
Learn how to use Claude to analyze Excel files, clean data, generate formulas, identify business insights, suggest dashboards and build automated reporting workflows.
Claude can now help with many Excel tasks that used to take hours of manual work.
Data analysis.
Error detection.
Excel formulas.
Chart suggestions.
Dashboard planning.
Executive summaries.
Recurring report workflows.
All of this can start with one spreadsheet and one clear prompt.
Claude does not replace your understanding of the business. But it can help you read data faster, detect patterns, reduce manual work, and turn spreadsheets into decision-ready insights.
According to Claude Help Center, Claude can work with uploaded files, including XLSX when code execution and file creation are enabled. Claude for Excel is also designed for professionals who work heavily with spreadsheets, especially in financial analysis and modeling. It can answer questions about workbooks, update assumptions, debug errors, build models and navigate multi-tab workbooks.
Here is the full workflow.
Why Claude Can Make Excel Work Faster
Most people look at spreadsheets row by row, column by column and sheet by sheet.
Claude can help you look at the data from a higher level:
- What does this data show?
- What are the main trends?
- Which rows look unusual?
- Which formulas may be wrong?
- Which metrics are rising or falling?
- Which customer groups matter most?
- What factors are driving revenue?
- What should the dashboard show?
- What does leadership need to know?
In other words, Claude does not only help you process a spreadsheet. It helps you turn a spreadsheet into a data story.
1. Upload Your Excel File to Claude
Start by uploading your spreadsheet directly to Claude.
This works especially well for:
- Sales data
- Financial reports
- Marketing analysis
- Inventory tracking
- KPI dashboards
- Business operations
- Customer lists
- Campaign performance
- Cost tracking
- Project progress
After uploading the file, ask Claude to understand the structure before analyzing it.
Prompt:
Please read this Excel file first.
Before analyzing it, tell me:
1. How many sheets are in the file?
2. What type of data does each sheet contain?
3. What are the main columns?
4. Which columns seem to be important metrics?
5. Is there anything I should know before analysis?
This helps you confirm that Claude understands the file correctly, especially if the workbook has multiple sheets.
2. Ask Claude to Analyze the Data Like a Business Analyst
Once Claude understands the structure, ask it to analyze the spreadsheet like a business analyst.
Prompt:
Analyze this spreadsheet like a senior business analyst.
Please explain:
- What this data shows
- The main trends
- Outliers
- Missing values
- Potential errors
- High-level business insights
Make the explanation clear, practical and focused on decision-making.
The goal of this prompt is not to create the final report immediately. The goal is to get a high-level view.
After this step, you will know where to go deeper: revenue, cost, inventory, marketing performance, customers, products or operations.
3. Automatically Generate the Right Excel Formulas
One of the most useful ways to use Claude is to ask it to write Excel formulas.
Claude can help with formulas such as:
- VLOOKUP / XLOOKUP
- INDEX MATCH
- SUMIFS / COUNTIFS / AVERAGEIFS
- IF / IFS
- IFERROR
- TEXT and DATE functions
- Conditional logic
- Profit margin calculation
- Forecasting
- Growth rate
- Moving average
- KPI calculation
Prompt:
Create the Excel formulas needed for this dataset.
I want to calculate:
- Growth rate
- Profit margin
- Forecast
- Average value
- Cumulative total
- Conditional logic
- KPI classification
For each formula, explain:
1. What the formula does
2. Which cell to place it in
3. Which columns it uses
4. How to drag it down to the remaining rows
5. What to watch for if the data is missing or wrongly formatted
Claude’s value is not only that it can generate formulas. It can also explain the logic behind them.
For example, instead of only returning:
=IFERROR((B2-A2)/A2,0)
Claude can explain that the formula calculates growth rate, avoids divide-by-zero errors and should be formatted as a percentage.
4. Clean and Correct the Data
A lot of Excel work is not analysis. It is data cleaning.
Common spreadsheet issues include:
- Duplicate rows
- Inconsistent date formats
- Inconsistent product names
- Numbers stored as text
- Missing values
- Broken formulas
- Inconsistent customer IDs
- Unreasonable outliers
- Extra spaces
- Manual input errors
Prompt:
Act as a data cleaning expert.
Review this file and identify:
- Duplicate data
- Inconsistent formats
- Missing values
- Wrong or suspicious formulas
- Outliers
- Data quality issues
- Columns that need standardization
Then suggest a specific correction method for each issue.
This step alone can save hours because Claude can help spot issues that are easy to miss manually.
For sensitive data such as finance, tax, payroll or legal reports, you should still verify the output using your internal review process before making decisions.
5. Ask for Business Insights
Once the data is cleaner, ask Claude for business insights.
This is where Claude moves from “spreadsheet assistant” to “business thinking partner.”
Prompt:
Act as a senior strategy consultant analyzing this spreadsheet.
Identify:
- The biggest opportunity
- The biggest risk
- Hidden trends
- Customer behavior patterns
- Revenue drivers
- Factors reducing performance
- Recommendations for growth
For each insight, include:
1. Evidence from the data
2. Business meaning
3. Recommended action
4. Priority level
A good insight does not only say “revenue increased.” It answers:
- Where did it increase?
- Why did it increase?
- Which group contributed most?
- Is the trend sustainable?
- What risk comes with it?
- What should we do next?
This is how a spreadsheet becomes a decision tool.
6. Create Visuals and Dashboard Suggestions
Raw data is hard to present. Charts and dashboards help people understand the story faster.
Claude can help suggest:
- The best chart types
- Dashboard structure
- Top KPIs
- Useful filters
- Data grouping
- Insights for each chart
- Executive-level summaries
Claude can create and edit Excel spreadsheets directly in the Claude app, and Claude for Excel is designed to integrate Claude into Excel workflows.
Prompt:
Suggest the most suitable charts and dashboard layout for this dataset.
For each suggestion, explain:
- Why this chart matters
- What insight it provides
- The ideal chart type
- Which data columns to use
- A good chart title
- A short management-level conclusion
Examples:
- Revenue by month → Line chart
- Revenue by product → Bar chart
- Revenue share by category → Donut chart
- Profit margin by product → Scatter plot or bar chart
- KPI by region → Heatmap
- Actual vs target → Combo chart
Claude can help you choose charts that are not just attractive, but analytically useful.
7. Build an Automated Reporting Workflow
When you repeat the same report every week or month, the real problem is no longer Excel. The real problem is workflow.
You can ask Claude to design a reporting workflow based on your spreadsheet.
Prompt:
Design an automated reporting workflow based on this spreadsheet.
Include:
- Recurring report schedule
- KPIs to track
- Alerts for unusual changes
- Summary structure
- Dashboard structure
- Automation suggestions
- Who should receive the report
- Report frequency
For recurring work, Claude Cowork scheduled tasks can be used for tasks such as daily briefings, weekly reports, and compiling data from spreadsheets or connected tools into formatted summaries.
This is when Excel becomes more than a file. It becomes part of your operating system.
8. Use Executive Summary Mode for Decision-Making
Not everyone needs to see the full spreadsheet.
Executives usually need to know:
- What is happening?
- What is the biggest problem?
- Where is the biggest opportunity?
- What risk needs attention?
- What decision should be made?
- What should happen next?
Prompt:
Summarize this spreadsheet as if you are presenting it to management.
Keep the content:
- Concise
- Strategic
- Data-driven
- Easy to understand
- Focused on decisions, risks and opportunities
Use this structure:
1. Executive summary
2. Top 3 insights
3. Key risks
4. Growth opportunities
5. Recommended actions for the next 30 days
This prompt is especially useful when you need to turn an Excel file into a management report.
Complete Workflow: From Excel File to Business Decision
Use this process:
- Upload the Excel file
- Ask Claude to understand the file structure
- Analyze the data like a business analyst
- Clean and correct the data
- Generate the required Excel formulas
- Identify business insights
- Suggest charts and dashboards
- Build an automated reporting workflow
- Create an executive summary
- Verify important findings before using them
This moves you from manual spreadsheet work to AI-assisted analysis.
Common Mistakes to Avoid When Using Claude with Excel
Claude is powerful, but it should not be used blindly.
Avoid these mistakes:
- Uploading a file without explaining the goal
- Asking for analysis before Claude understands the structure
- Ignoring missing or badly formatted data
- Using AI-generated formulas without testing them
- Confusing correlation with causation
- Uploading sensitive data without reviewing privacy policies
- Making major decisions based only on AI-generated insights
Think of Claude as an analyst assistant, not the final authority.
Conclusion: Claude Can Turn Excel from a Spreadsheet into a Decision System
Claude does not only help you read Excel faster.
Used well, it can help you analyze data, generate formulas, find errors, identify insights, suggest charts, design dashboards, build reporting workflows and summarize findings for leadership.
The difference is not whether you have data. Everyone has data.
The difference is whether you can turn that data into decisions.
Claude can help you do that faster.
CTA
The next time you have an Excel file to analyze, do not start by manually checking every sheet. Upload the file to Claude, begin with a structure-analysis prompt, and then move step by step through cleaning, formulas, insights, dashboards and executive summaries. Your spreadsheet can become a decision-making system, not just a file full of rows and columns.
FAQ 1: Can Claude analyze Excel files?
Yes. Claude can work with spreadsheet files such as XLSX when the required file upload and code execution features are available. Claude for Excel also allows users to ask questions about workbooks, navigate sheets, debug errors and work with spreadsheet models.
FAQ 2: Can Claude create Excel formulas?
Yes. Claude can help generate Excel formulas such as XLOOKUP, INDEX MATCH, SUMIFS, COUNTIFS, IF, IFERROR, growth rate, profit margin and KPI calculations. You should still test the formulas before using them in important reports.
FAQ 3: Can Claude help clean spreadsheet data?
Yes. Claude can help identify duplicate rows, inconsistent formats, missing values, suspicious formulas, outliers and other data quality issues. It can also suggest correction methods.
FAQ 4: Can Claude create dashboards from Excel data?
Claude can suggest dashboard layouts, chart types, KPI structures and executive summaries based on Excel data. Depending on the available features, Claude may also create or edit spreadsheet files directly.
FAQ 5: Is Claude suitable for business data analysis?
Claude can be useful for business data analysis, especially for summarizing trends, identifying risks, finding opportunities and generating management-level insights. However, important business decisions should still be validated by humans.
FAQ 6: What is the best prompt for Excel analysis with Claude?
A strong prompt should ask Claude to first understand the workbook structure, then analyze trends, outliers, missing values, errors and business insights. It should also specify the role, such as senior business analyst or strategy consultant.